Introduction
Korea has always achieved high academic achievement in TIMSS and PISA, which are conducted every cycle. On the other hand, the results of self-confidence, interest in mathematics, and satisfaction with life showed a lower rank, showing almost opposite results in mathematics achievement and affective domain. One of the reasons for this is 'Math Anxiety'. Math anxiety is a feeling of tension or anxiety related to mathematics or fear of performing mathematics. Students with high math anxiety feel reluctant to learn math, have low confidence in math subjects, and passively participate in math learning (Ashcraft & Moor, 2009; Lee, 2002). Also, if math anxiety is too high, math anxiety suppresses working memory activity, which can negatively affect math academic achievement (Ashcraft & Kirk, 2001). The continuation of this phenomenon can be a major stumbling block to mathematics as a basic study that contributes to national development.
Therefore, it is necessary to continuously study ways to overcome math anxiety, and to do so, an accurate diagnosis should be given priority. Since math anxiety gets worse as the school grade level increases and grade level increases (Wigfield & Meece, 1988), it is effective to diagnose and prevent it in the relatively early period of elementary school students. Until now, many test tools such as MARS (Mathematics Anxiety Rating Scale) and MAS (Mathematics Anxiety Scale) have been developed to diagnose math anxiety. Therefore, it is necessary to develop a test tool that can measure quantitatively and objectively, and as an alternative, brain imaging techniques can be used. There are EEG, MEG, and f-MRI as brain imaging techniques, but they have various limitations such as cost, space, and safety. An alternative is functional Near Infrared Spectroscopy (f-NIRS), which is very lightweight and relatively inexpensive. f-NIRS is a technology that uses harmless near-infrared rays to measure brain activation by changes in hemoglobin concentration in the blood. In this study, we tried to develop a task as a mathematical anxiety test tool using the f-NIRS-based NIRSIT device that can supplement the limitations of other brain imaging techniques.
Background
Math Anxiety
Definition of Math Anxiety
The term ‘math anxiety’ was initially used as ‘number anxiety’ and has been mentioned since the 1950s. After Dreger & Aiken (1957) defined it as a symptom of emotional response to mathematics or arithmetic, various definitions have been made by many researchers. Fennema & Sherman (1976) defined math anxiety as anxiety, fear, physical symptoms, and neurotic symptoms that occur during math learning. Richardson & Suinn (1972) extended math anxiety to everyday life and defined math anxiety as anxiety and tension felt when facing numbers as well as learning situations in math. Kim & Heo (1995) expanded the scope not only to test situations but also to anxiety that appears when expecting situations to occur with mathematics learning. Harari et al. (2013) divided math anxiety into anxiety that occurs during the act of doing math, such as when solving a math problem, and anxiety that occurs in the process of anticipating the act.
In this study, math anxiety was defined by narrowing the scope to ‘neurological symptoms such as anxiety and fear occurring in math learning situations’ commonly included in all definitions.
Causes of Math Anxiety
Math anxiety is caused comprehensively by various factors, and the exact cause has not yet been identified. Several researchers have identified various factors, largely personal factors such as gender, self-confidence, genetics, and academic achievement in mathematics; socio-environmental factors such as home environment, classroom experience, teachers, and social attitudes; There are factors according to the characteristics of mathematics subjects, such as systematicity.
Ma & Xu (2004) conducted a longitudinal study to find out the relationship between math achievement and math anxiety. They found that math anxiety increased due to low math achievement rather than math achievement decreased due to high math anxiety. Wang et al. (2014) found that genetic factors affect math anxiety by about 40%. Among the factors of math anxiety, most of the studies assumed that gender differences occur due to biological differences in the early stages, but Ho et al. (2000) found that there was no difference in math anxiety according to gender. Recently, it has been argued that low social expectations for female students' math achievement, not biological differences, lead to high math anxiety and low academic achievement (Schmader et al., 2008).
Malonet et al. (2015) argued that students who asked for help from parents who had high math anxiety when working as journalists penetrated math anxiety. It was thought that parents with high math anxiety could reveal their flaws in math and suggest confusing problem-solving strategies by expressing their legitimate claims or experiences about math in childhood. Ball (1990) found that students' math anxiety can vary depending on the teacher's math anxiety and that teachers with high math anxiety teach arbitrarily or overemphasize rote learning, which increases students' math anxiety in their class. This shows that socioenvironmental characteristics can affect math anxiety.
The characteristics of mathematics subjects, such as abstractness and logic, can also cause students' anxiety in mathematics. Lazaru & Buxton (1982) said that mathematics anxiety occurs due to the characteristics of mathematics itself or the symbols and terms of mathematics. Ferguson (1986) said that mathematical anxiety occurs due to the abstractness of mathematics.
Measurement Tools for Math Anxiety
The first math anxiety test tool was the number anxiety test tool developed by Aiken & Dreger (1957) to find out attitudes toward mathematics. Subsequently, the Mathematics Attitudes Scale (MAS) and the Mathematics Anxiety Rating Scale (MARS) were developed by Aiken (1970) and Richardson & Suinn (1972). In addition, Fennema & Sherman (1976) developed the Mathematics Anxiety Scale (MAS) to examine attitudes toward learning mathematics, and researchers such as Plake & Parker (1982) and Ferguson (1986) also reviewed previous studies. Based on this, various test tools were developed to measure math anxiety.
In Korea, Choi (1998) developed a math anxiety scale targeting middle school students, and Heo (1996) developed an assessment tool to find out factors of math anxiety targeting high school students. Kwon (2003) developed a questionnaire to find out the sub-factors of math anxiety targeting elementary school students. Since the questionnaire-type testing tool doubts the accuracy of the respondent's self-recognition and self-report (Dowker et al., 2016), It is necessary to develop a cognitive nervous system mathematics anxiety test tool using brain imaging techniques to support a questionnaire-type test tool to secure objectivity.
Cognitive Neurology
Math Anxiety & Prefrontal Cortex
Rauch et al. (1997) found that the right orbitofrontal cortex (OFC) and right inferior prefrontal cortex were activated in research participants with neurological problems. Also, Davidson et al. (2002) found that activity increased in the anterior OFC of the right brain and the upper-middle-lower frontal gyrus while participants viewed a picture reminiscent of negative emotions. These two studies have in common that they found that the right OFC area is related to negative emotions.
The brain has a dorsolateral prefrontal cortex associated with math anxiety and working memory. Several researchers have argued that the ability to utilize working memory is reduced when math anxiety is high (Ashcraft & Kirk, 2001; Vukonik et al., 2013), and the key area responsible for such working memory is the dorsolateral prefrontal cortex. In addition, Young et al. (2012) found that the activity of the dorsolateral prefrontal cortex (DLPFC) decreased in a group with high math anxiety compared to a group with low math anxiety.
Math Anxiety &Cognitive Neurology
The development of brain imaging measurement techniques has made it possible to observe neurophysiological responses to cognitive functions (Hansen & Monk, 2002). Campbell (2006) introduced the term ‘mathematics education neuroscience’ and argued that evidence-based and objective views should be provided for research in mathematics education. Physiological data such as pupil response, EEG, eye tracking, and skin response were used to establish this evidence-based view.
In this trend, since math anxiety also includes emotional responses to math, research on cognitive neuroscience on math anxiety has become activated. Young et al. (2012) collected brain activity data according to math anxiety targeting lower-grade elementary school students. As a result, it was found that the activity of the dorsolateral prefrontal cortex region decreased and the activity of the right amygdala increased in the group with high math anxiety compared to the group with low math anxiety. Lyons & Beilock (2012a) divided adults into high and low math anxiety groups and conducted an fMRI study while anticipating and performing math problems. As a result, compared to the group with low math anxiety, the group with high math anxiety had lower frontal and parietal lobe activity and lower math achievement.
As such, research is being conducted to understand the neurological basis of math anxiety through physical responses to math anxiety. Alloway & Alloway (2014) reported that math anxiety is related to working memory, which is in charge of the dorsolateral prefrontal cortex, and saw that math anxiety could be resolved by helping to improve working memory.
f-NIRS
‘Functional Near Infrared Spectroscopy (f-NIRS)’ is a technique that measures the hemodynamic response by radiating near infrared rays to the prefrontal cortex. This technology has recently attracted attention from cognitive neurologists and has advantages such as ease of movement and autonomy of movement, and is a relatively safe method because it is non-invasive (Ferrari & Quaresima, 2012).
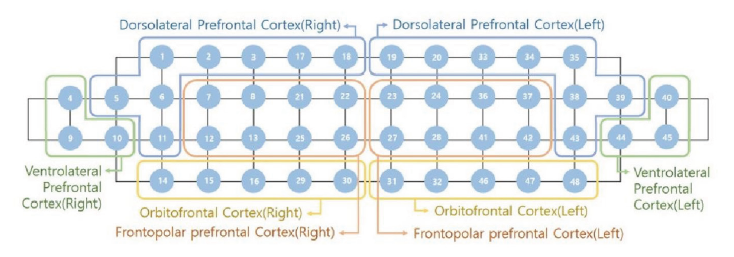
In this study, it was measured using OBELAB's NIRSIT (OBELAB, Seoul, Korea) using the principle of f-NIRS. The NIRSIT device can measure brain areas as shown in Fig. 1.
For studies using f-NIRS, Himich et al. (2015) measured the hemodynamic activity of the prefrontal cortex in female participants. Assuming that the activity of the lateral prefrontal cortex would be suppressed due to negative emotions, they measured the brain signals of patients while patients watched various images. As a result, the activity of the lateral prefrontal cortex on both sides was significantly improved when watching the video without emotional change compared to the video in which the emotional change occurred. The activity of the lateral prefrontal cortex decreased after watching a video that generated negative emotions.
Methods
Progress
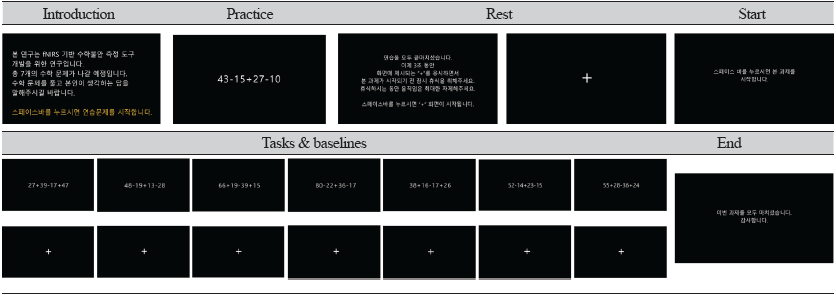
To develop the f-NIRS-based NIRSIT math anxiety test task, the study was conducted in stages of designing a math anxiety test task and verifying the validity of the devised task. In the stage of designing the test task, the measurement task was developed, the brain region to be measured was selected, and the development task was verified. Through previous studies using brain imaging techniques, 7 double-digit addition and subtraction mixed calculation problems were selected as tasks, and the difficulty of the tasks was modified through preliminary experiments. In addition, through several previous studies related to the brain, the dorsolateral prefrontal cortex (DLPFC), which is in charge of working memory related to math anxiety, and the orbitofrontal cortex (OFC), which is in charge of emotion, are measured in the brain area was selected. In the step of verifying the test tools, the brain activity between the two groups was compared, and the correlation between the self-reported math anxiety score and brain activity was analyzed.
Participants
The participants in the study were 5-6th grade elementary school students. To minimize variables, 2 students with cardiovascular or neurological diseases or who were left-handed were excluded, and finally 48 students were selected as participants. Based on the results of the math anxiety questionnaire test (Kwon, 2003), the selected participants were classified as High-Math-Anxiety[HMA] group for the top 50% and Low-Math–Anxiety[LMA] group for the bottom 50%.
Measurement
NIRSIT developed by OBERAB was used to measure brain activity based on f-NIRS. NIRSIT is a device that uses near-infrared light, which is harmless to the human body, and measures oxygen saturation in the blood to determine the level of brain activity.
In order to prevent math anxiety that occurs in an unprepared state, the type of assignment was notified in advance, and the measurement time, procedure, measurement posture, and precautions were provided. The measurement environment was conducted in an empty classroom with dark lighting to avoid direct sunlight. The measurement was carried out after wearing the device by turning it over so that the hair or eyebrows do not touch the device as much as possible.
Developing the Measurement Task
In order to develop an f-NIRS-based math anxiety task, I analyzed and measured my peers, straightened the ends, and selected the content of the task through a review of Asian studies. After selecting the first question and writing the preliminary specifications, the final work was produced by correcting and supplementing the question.
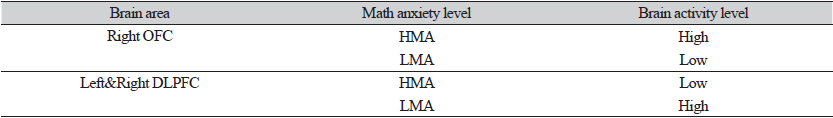
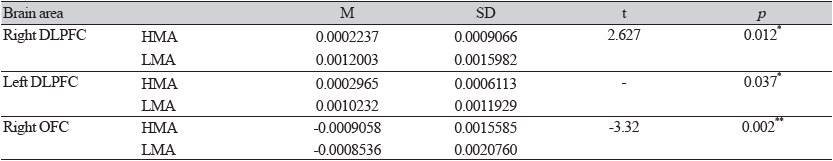
Previous studies related to negative emotions or anxiety were analyzed to identify the brain regions in which activation differences occur according to the level of mathematical anxiety. In this study, bilateral DLPFC and right OFC regions were selected as brain region factors for math anxiety measurement, and the brain activity levels according to math anxiety levels are shown in Table 1.
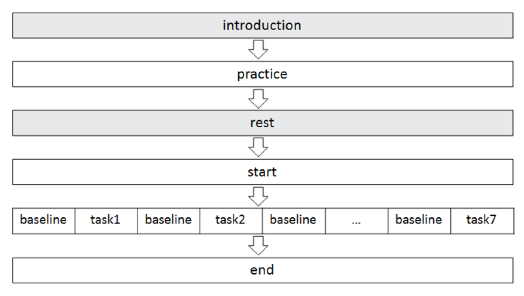
The block design in which an active task and a control task are presented alternately was used to configure the math anxiety measurement task. In this study, it was judged that students would not be able to maintain a stable state during the break between questions, so the break before the start of all tasks was used as a control task.
Usually, a pair consisting of one activation task and one control task is called one block, and at least 5 blocks are required to secure reliability (Kohs, 1920). In this study, since the rest time between questions was set as gaze fixation time, a total of 7 blocks were designed by setting 1 question and 1 gaze fixation time as 1 block, and the detailed configuration is shown in Fig. 2.
The task was created using Psychopy, and it was interlocked with f-NIRS to measure the participants' brains in real time during the task solving process.
The type and difficulty of the task were selected by analyzing previous studies related to mathematical anxiety, and as a result, 7 questions were selected for addition and subtraction mixed calculations in the area of numbers and calculations, which are capable of mental arithmetic and have relatively simple formulas.
After the preliminary test, it was confirmed that the students solved the problem faster than the given time, and the task solution time was adjusted to 30 seconds per question. The final task is shown in Table 2.
Analysis
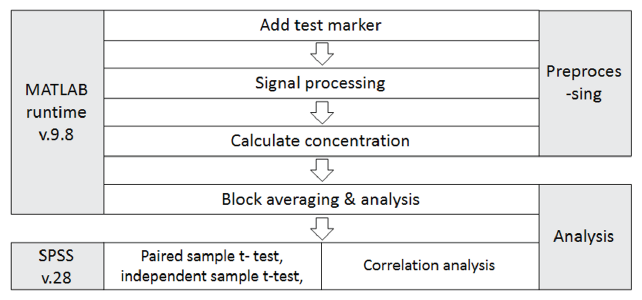
NIRSIT PC Tool software was used to collect the students' brain activity data. After preprocessing the raw data, which is the measurement result, with MATLAB Runtime version 9.8 software, average brain activity data of both DLPFC and OFC areas were calculated for each group in a rest state and during task performance. After dividing into high anxiety group and low anxiety group based on the calculated data, SPSS (v.28) program was used to analyze differences in brain activity within and between groups through paired-sample t-test and independent-sample t-test, respectively. The detailed data analysis procedure is shown in Fig. 3.
Results
Reliability Analysis of the Task
In this study, questions for the preliminary examination were devised through brain research-related literature and previous studies, and the questions were modified after the preliminary examination was conducted. The corrected questions were put into the main test, and reliability was analyzed based on the results. As a result, the reliability of the devised task(including 7 questions) was 0.775, which can be said to be reliable.
Analysis of Brain Activity within Groups
The NIRSIT device can measure the concentration of oxyhemoglobin and deoxygenated hemoglobin in the prefrontal cortex bloodstream. In this study, the data were collected by measuring the concentration of oxyhemoglobin in both DLPFC and right OFC. The average concentration of oxyhemoglobin in each group of HMA and LMA was obtained during the rest state for complete relaxation and during task performance, which is an activity to solve problems, and the difference was compared. The experiment was carried out on the assumption that if a significant difference in brain activity occurs between the rest state and the task performance, it means that the mathematical anxiety test task developed in this study was properly designed.
Brain Activity Analysis of HMA
As a result of analyzing the brain activity during the rest state and task performance within the HMA group, a significant difference (p<.05) was shown in the left DLPFC and right OFC except for the right DLPFC region (p<.05) as shown in Table 3.
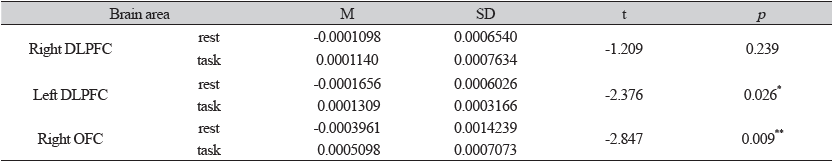
When math anxiety is high, the ability to work function decreases, and the brain area responsible for this working memory is the DLPFC (Ramirez et al, 2013; Vukonic et al, 2013). Therefore, it can be assumed that there was no significant difference in the DLPFC area on the right side of the HMA. In addition, it can be seen that in all three areas, more activations occurred during task execution than in the rest state. In addition, it can be seen that in all three areas, more activations occurred during task execution than in the rest state.
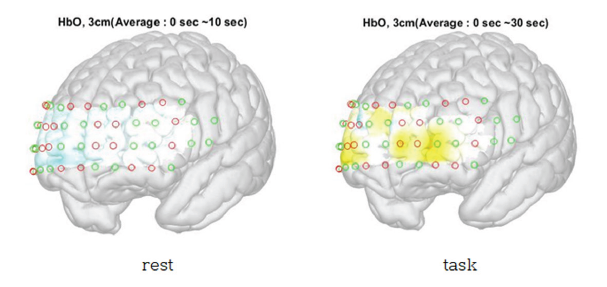
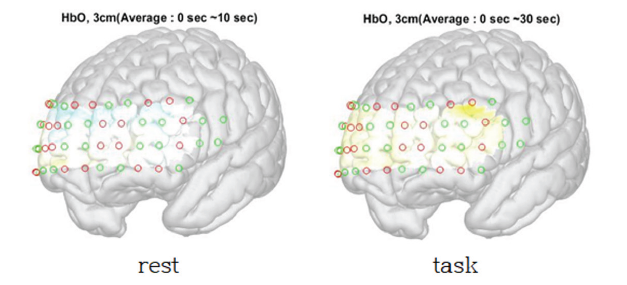
Fig. 4 is a 3D brain image showing the average activity of the entire prefrontal cortex measured when the HMA is in the resting state and performing the task.
Brain Activity Analysis of LMA
As a result of analysis of brain activity during the rest state and task performance within the LMA group, a significant difference (p<.05) was found in both DLPFC regions except for the right OFC region as shown in Table 4. The lateral right OFC region increases activity when negative emotions are felt, and the medial OFC region increases activity when positive emotions are felt. Since the NIRSIT device can only measure the lateral prefrontal cortex, it can measure only the students' negative emotions. Therefore, since LMA students are students with low math anxiety, it is difficult to assume that their activity increased when they were in a rest state because they felt negative emotions.
Fig. 5 is a 3D brain image showing the average activity of the entire prefrontal cortex measured when the LMA is in the rest state and performing the task.
Analysis of Brain Activity between Groups
To secure the reliability of the designed task, the difference in brain activity between the HMA and LMA was analyzed during task performance. The brain regions selected for analysis were the bilateral DLPFC and right OFC regions. If a significant difference occurs with the test task developed in this study, such as the results of the self-report survey, it means that it can be used as a task for future math anxiety tests.
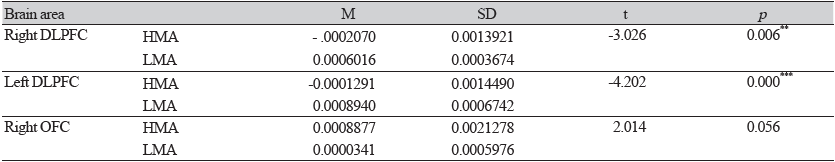
Brain activity in the three regions was measured and averaged while both groups performed the task. As a result of analyzing the average values through independent sample t-test and Mann-Whitney test, statistically significant differences (p<.05) were shown in all three areas as shown in Table 5. Compared to LMA, the mean value of brain activity was lower.
Fig. 6 is a comparison of 3d brain maps showing the average activity of the entire prefrontal cortex measured when the HMA and LMA are performing a task.
Correlation between the Self-report Test and the Developed Task
To secure the reliability of the designed math anxiety test task, the results of Pearson's correlation analysis of the self-reported math anxiety test scores and the measured values obtained with the math anxiety test task developed in this study are shown in Table 6.
|
Table 6. correlation analysis between brain activity and math anxiety test scores 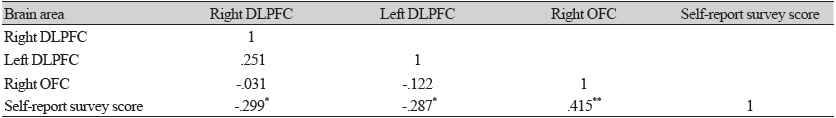
|
|
*p<0..05, **p<0..01 |
All correlations except for the relationship between the right OFC and the left DLPFC and the relationship between the right DLPFC and the left DLPFC showed significant results. In particular, there was a significant correlation between the self-report math anxiety test score and all three brain regions. The higher the math anxiety, the higher the test score, and the lower the activity of both DLPFCs, the higher the math anxiety, so it can be interpreted as showing a negative correlation.
Discussion
First, students with high math anxiety have less activity in the DLPFC than students with low math anxiety. In the brain activity analysis between groups, the brain activity of the DLPFC on both sides of the HMA was smaller than that of the LMA. This is consistent with previous studies such as Young et al. (2012) and Lyons & Beilock (2012a), which found that the activity of the DLPFC, which is responsible for working memory, decreases when math anxiety is high.
Second, when the designed test task was used, a significant difference in brain activity was observed between the high-anxiety group and the low-anxiety group. Statistically significant differences were found in both the bilateral DLPFC and right OFC regions of the two groups while solving 7 problems within the test task. Through this, Davidson et al. (2002) found that the right OFC area is related to anxious feelings. And Wu & Menon (2012) found that there was a difference in DLPFC activity between the two sides of math anxiety. The results of this study also appeared consistent.
Third, the designed test task shows a statistically significant correlation with the existing self-report math anxiety test. Both sides of the DLPFC and right OFC showed significant correlations between self-report math anxiety test scores and Pearson's correlation analysis results. Through this, it was confirmed again that emotional responses can be measured through the f-NIRS-based NIRSIT device (Himich et al, 2015), and in this study, the subject was expanded to elementary school students. These results show the possibility that the test task developed in this study can be used as a tool to measure math anxiety, replacing the self-report math anxiety test.
Conclusion
Based on the results of this study, the following conclusions were drawn.
First, math anxiety can be measured using the f-NIRS-based math anxiety test task developed in this study. As a result of the experiment, there was a statistically significant difference in all measured brain elements between the high and low math anxiety groups. In addition, as a result of the correlation analysis, there was a significant correlation with the survey-type math anxiety test score. In particular, the result of a negative correlation between the math anxiety score and the activity of both DLPFCs means that this area is likely to be used to discriminate math anxiety. If you measure brain activity with a mathematical anxiety test tool using NIRSIT based on f-NIRS, you can check the data with images and numbers. Since the data obtained in this way can be processed statistically, it is possible to quantitatively confirm how much activity has occurred in which area when solving a math problem for each level of math anxiety. Therefore, it can be used as a test tool that can measure the emotional response occurring in the brain along with the existing self-report math anxiety test tool.
Second, students with high math anxiety should be provided with support to help their working memory during math learning. In the brain activity analysis between groups, the brain activity of the dorsolateral prefrontal lobe of the high math anxiety group was lower on both sides compared to the low math anxiety group. The dorsolateral prefrontal cortex is an organ responsible for working memory, and its activity decreases when math anxiety is high (Ashcraft & Kirk, 2001; Lyons & Beilock 2012a; Vukonik et al., 2013; Young et al., 2012). According to previous studies, math anxiety can be resolved in a way that helps improve working memory. Specifically, for students with high math anxiety, structured and consistent classes, conversations that can support working memory in the process of problem solving, and simplified rules are needed to set realistic learning goals (Alloway & Alloway, 2014).
Third, the development of test tools based on cognitive neurological mechanisms should be expanded. In this study, a cognitive neurological mechanism-based math anxiety test task was developed and its possibility confirmed. As such evidence-based collection of biological responses becomes possible through physiological data such as pupil response, EEG, eye tracking, and skin response, including f-NIRS, it should provide an evidence-based and objective view for mathematics education research (Campbell, 2006) reinforces the argument. Until now, most of the self-report questionnaire survey tools have been developed, and the questionnaire has a limitation in that it cannot examine the cognitive process that emotions go through according to the mechanism occurring in the brain. As such, it is necessary to apply cognitive neurology to the educational field, but the subject and field of educational research at home and abroad are very limited. In the meantime, the economic and spatial limitations of cognitive neurological measurement equipment have been great, but it is necessary to expand the development of evidence-based test tools by utilizing methods that minimize the limitations, such as f-NIRS.
Suggestion
Based on this study, the following follow-up studies are needed.
First, research data from more participants are needed to be used as a standardized math anxiety test tool. In this study, an f-NIRS-based math anxiety test task was developed for 5-6th grade students in elementary school, but the number of participants and subjects for standardization are limited. It is believed that it can be commercialized as a math anxiety test tool if data of research participants belonging to various age groups are secured through additional research and the results of the study are generalized.
Second, it is necessary to use various measurement tools other than f-NIRS to understand the cognitive neurological basis of math anxiety. Until now, studies using imaging techniques such as f-MRI and EEG have been conducted to understand the basis of mathematical anxiety, but the number is very insufficient. The f-NIRS technology has advantages such as relatively low cost and free movement, but has limitations in that it can only measure brain activity in the prefrontal cortex. Since emotional responses do not occur only in the prefrontal cortex, many studies are needed to complement the limitations of each technique and to understand the cognitive neurological basis of mathematical anxiety using various devices.
Third, it will be possible to develop and utilize a mathematical anxiety test tool using f-NIRS in various areas. In this study, a math anxiety test tool was developed limited to 6th grade students, number and arithmetic, and there are limitations in measuring math anxiety in other areas or participants in other grades. Therefore, by diversifying measurement tasks and developing various test tools according to domain, difficulty, and grade, various models of f-NIRS-based math anxiety test tools can be presented.