Abstract
The purpose of this study is to examine the types of infographics made in science classes and perceptions of science classes using infographics according to the cognitive styles of middle school students. To this end, the group Embedded Figures test was conducted on 106 second-year middle school students, and 21 the field-independent type and 30 the field-dependent type were selected as the study subjects. The science class using infographics consisted of a total of 20 classes. The class consisted of an introduction to infographics and an orientation stage on how to create infographics, infographics understanding stage to identify infographics materials related to the class topic, and a stage to create infographics using a production tool. The students' perception of the class after science class using infographics was investigated, and the types of infographics produced by the students were analyzed according to the cognitive style. The study results are as follows. First, among the types of infographics produced by students, there was no significant relationship between the visual expression type and the cognitive style, but there was a correlation between the construction method and the cognitive style. the field-independent students used simple reconstruction, relocation, and reorganization methods to find and apply more information than the field-independent students. Second, there was a difference in the perception of science class using infographics according to the cognitive style. In all areas such as the effect of using infographics, difficulties in creating infographics, whether other science subjects were used, activity and interest, etc., the field-independent students perceived more positively about classes using infographics than the field-dependent students. Based on this study suggest that science classes using infographics should design teaching and learning plans suitable for the field-independent and field-dependent students, and that more systematic instruction and guidance are needed, especially for effective infographics use classes for students with the field-dependence.
Figures & Tables
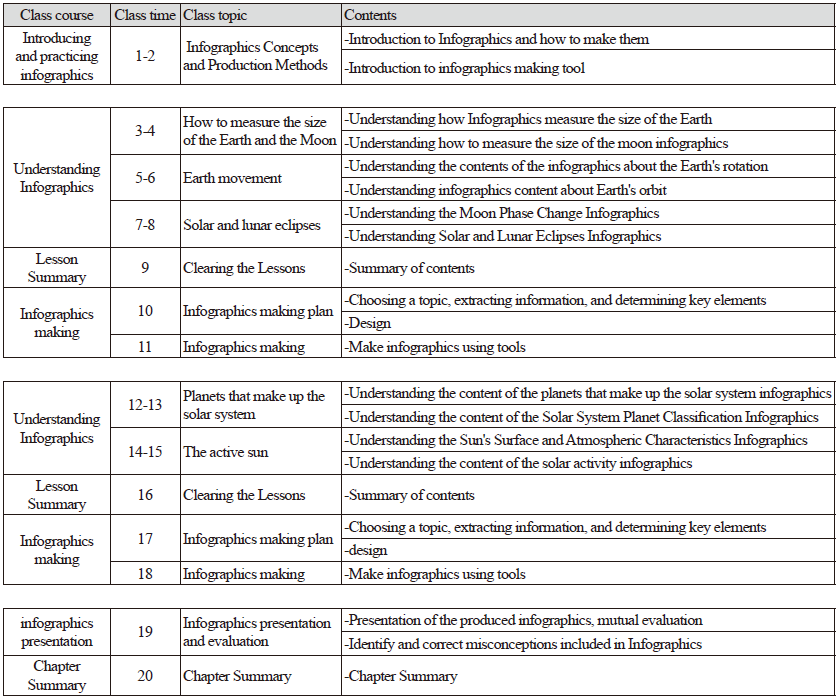
Fig. 1. Flowchart of the science classes using infographics